Sight Automation API Integration
In-situ instrumentation combined with probabilistic forecasting creates the next generation of insights for earthwork assets. The shift represents a significant advancement in the monitoring and management of earthwork assets such as embankments, waterways, dams, highways and in construction projects. The Sight Automation approach leverages real-time data collection and advanced analytical techniques to provide more accurate, predictive, and actionable insights for clients.
How it Works
Sight Automation is manufacturer agnostic. This means API data from all sources can be integrated into our flagship portal. It can be displayed together in a way to keep it aesthetically consistent and easy to navigate, to provide the best insights for clients.
For example, Sight Automation was able to seemlessly integrate a weather API into a dashboard. This proved to be advantageous by giving the client the ability to interpret data where rainfall was influencing ground movement.
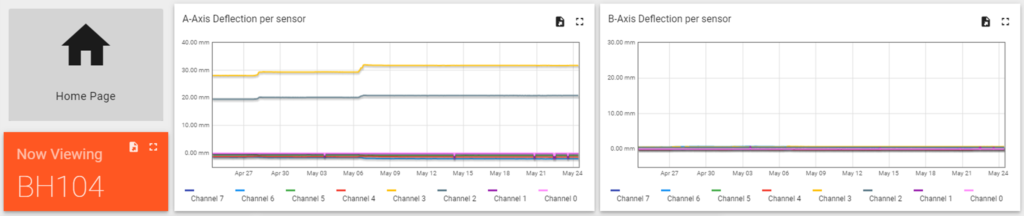
Sight Automation Portal of time plots requested by our client to show movement on an embankment to monitor an active slip. The client used IPIs with ground pressure, water level sensors and a weather station, all installed by Sight Automation, to provide a full insight into events which are increasing the rate of failure.
Here’s how this works:
API Integration:
- Compatibility with Multiple Data Sources: Sight Automation’s platform can integrate data from a wide range of sensors and instruments, regardless of the manufacturer. This ensures that clients are not limited by compatibility issues.
- Unified Data Access: APIs from different sources are standardised and aggregated within the portal, providing a single point of access for all relevant data.
Comprehensive Data Display:
- Customisable Dashboards: Sight Automation can customise dashboards to display the most relevant data for client specific needs. This could include real-time monitoring data but also add historical trends.
- Visualisation: Advanced visualisation tools help in presenting complex data in an easily understandable format, such as graphs, charts, and heat maps.
Seamless Navigation:
- User-Friendly Interface: The portal is designed with an intuitive user interface, with the aim to make it easy for users to navigate through different datasets and reports.
- Integrated Insights: Data from various sources are integrated to provide insights, enabling users to make more informed decisions.

Vertical Inclinometer plot hosted on Sight Automation to provide data within one easy to access location.